Monday, July 1, 2019

Climate Science: Fourier & the Greenhouse Effect

Part 1: The Early Beginnings of Climate Science: Fourier & the Greenhouse Effect


The idea of a greenhouse effect has been around since Fourier.  Indeed, the greenhouse effect is a good thing when kept in check as it keeps Earth warm enough to support life. The issue that we're facing now is that we're out of equilibrium - too much of a good thing. Then, learn how the observations of an amateur naturalist led to important scientific theories regarding Ice Ages and climate change. Finall
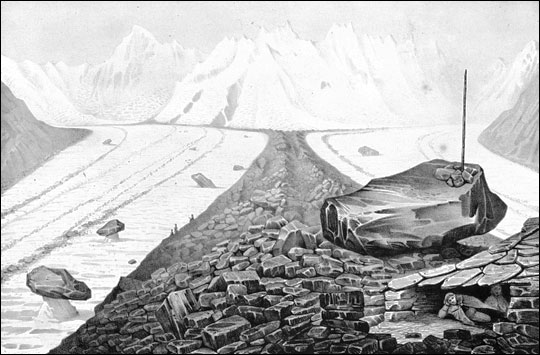
y, we discuss the early studies that connected carbon dioxide to climate and global temperature.

Ironically, one of the theories proposed to explain what had caused the Ice Ages to come and go would become the key argument supporting an opposite, and equally controversial, kind of climate change: global warming. In 1895 Svante Arrhenius proposed that the drop in temperatures that occurred during the Ice Age could have been produced by a drop in the concentration of atmospheric carbon dioxide compared to the then-current levels. He even proposed that industrial emissions could raise Earth’s temperature in coming centuries.

Despite his theory, most scientists didn’t believe that humans could affect climate until the 1960s, when evidence of human impacts on the natural world were becoming increasingly obvious. Once again, climate change became controversial, as the theory of global warming became one of the biggest scientific debates of the late twentieth century. The questions of the past generation took on a new urgency. Could climate change be a threat to humankind? And could our own actions increase the threat?
These questions have compelled scientists to scour the Earth for signs of past climate change. Their search has developed into an entire scientific field: paleoclimatology, the study of past climates. In determining what has triggered climate change in the past, scientists hope to learn how natural and human triggers might change our climate in the future.
Most scientists who study the past have fossils and artifacts that help them reconstruct history. But without thermometer readings, how can they know how cold it was when the ice from the last Ice Age began to retreat? Scientists who want to reconstruct past climates gather clues buried in the Earth in much the same way that an archeologist reveals past culture by looking at artifacts or a detective reconstructs a crime scene using multiple bits of evidence.
Climate leaves an imprint on the planet, in the chemical and physical structure of its oceans, life, and land. Some of these artifacts, known as climate proxies, reveal general climate patterns over the entire Earth, while other proxies reveal seasonal change in specific regions. By reading the signs of past climate, scientists reconstructed the history of Earth’s climate over hundreds of thousands—in some cases millions—of years. When combined with observations of Earth’s modern climate into computer models, paleoclimate data help scientists to predict future climate change.


Climate Close-up
by Holli Riebeek· design by Robert Simmon· December 22, 2005
Climate Close-upThis history in trees tells us the climatic story of the Southwest with amazing accuracy. When a real theory of climate has been developed and we can predict drought and flood over a period of years, this Arizona story in tree rings will have played a creditable part in developing that climatic foresight which is perhaps the most valuable economic advantage yet lying beyond our reach.” –Andrew Ellicott Douglass, 1929
While cave rocks and ice cores provide a long-term, annual record of past climate (see “Written in the Earth” and “The Ice Core Record” in this series), some other climate proxies can offer a detailed record of seasonal temperature or rainfall changes. As they grow from season to season, coral reefs in the oceans and trees on the land both record small variations in the climate. These records can tell scientists about growing conditions in the oceans or on the land, but the record only stretches across the collective lifetimes of the organisms that have been preserved through the centuries. Thus, even though their records are more detailed, reefs and trees cannot provide records that are as long or continuous as ice or sediment core records.
by Holli Riebeek· design by Robert Simmon· December 19, 2005
Richard Alley might have envied paleoceanographer Jerry McManus’ warm, ship-board lab. (See previous installment: “A Record from the Deep.”) One of the researchers in the Greenland Ice Sheet Project 2 (GISP2), Alley huddled in a narrow lab cut into the Greenland Ice Sheet, where “the temperature stayed at a ‘comfortable’ twenty below [Fahrenheit],” he wrote in his book about his research, The Two-Mile Time Machine. An assembly line of science equipment lined the twenty-foot-deep trench that served as a makeshift lab. For six weeks every summer between 1989 and 1993, Alley and other scientists pushed columns of ice along the science assembly line, labeling and analyzing the snow for information about past climate, then packaging it to be sent for further analysis and cold storage at the National Ice Core Laboratory in Denver, Colorado. Nearby, a specially built drill bored into the thick ice sheet twenty-four hours a day under the perpetual Arctic sun. Essentially a sharpened pipe rotating on a long, loose cable, the drill pulled up cores of ice from which Alley and others would glean climate information

Tree Rings

Squat and gnarled, Methuselah clings to the rocky slopes of the White Mountains in Southern California as it has for the past 4,770 years. When the ancient bristlecone pine took root, the earliest Greek civilization was being established and the Egyptians were just beginning construction of the Pyramids of Giza. Thousands of years later, both those civilizations are long gone, but Methuselah lives on. It is one of the Earth’s oldest known living organisms.
The barren limestone soil around the tree is bare of grass or other plants, supporting only a widespread grove of scraggly Bristlecone Pine trees, at least one of which is even older than Methuselah. At about 11,000 feet above the arid Great Basin Desert, the trees receive precious little water—hardly a location hospitable to any life, let alone the oldest of living organisms. Ironically, it is the barrenness of the location that has allowed the trees to live so long. With no surrounding fuel, lightning-ignited forest fires can’t engulf the grove.

The Methuselah Walk, high in the White Mountains of California, winds among the oldest known trees in the world. The ancient and twisted bristlecone pines grow extremely slowly, preserving a history of climate in their annual growth rings. The bristlecone climate record goes back 9,000 years, contained in living and dead wood as old as the last ice age. (Photograph copyright Dave Westwood
The inhospitable environment has also made the trees excellent recorders of rainfall. Each year, the trees grow wider, adding another ring to their girth. Most people have counted the number of rings in a tree stump to find out how old the tree was, but the rings also tell about growing conditions the year it formed. High in the Great Basin Desert, where water is scarce, the growing conditions are most directly influenced by rainfall.'
Variation in the closely spaced rings of a bristlecone pine correspond to annual changes in rainfall and temperature. (Photograph copyright Henri D. Grissino-Mayer)
In the 1890s, a young astronomer at the Lowell Observatory in Flagstaff, Arizona, was trying to understand how sun spot cycles might affect plant growth. In his research, Andrew Ellicott Douglass noticed that the thickness of each ring in the pines and Douglas firs in the region depended on how much rain fell during the year. He wrote, “Through long-past ages and with unbroken regularity, trees have jotted down a record at the close of each fading year—a memorandum as to how they passed the time; whether enriched by added rainfall or injured by lightning and fire…. So, in the rings of the talkative pines we find lean years and fat years recorded. The same succession of drought and plenty appears throughout the forest.” Because all of the trees in the area exhibited the same pattern of thick and thin rings, Douglass was able to construct a tree calendar going back to AD 700 by piecing together the tree ring patterns of living trees and patterns found in wood preserved in Native American Pueblo villages.

Andrew Ellicott Douglass (left) and Edmund Schulman (right) pioneered dendrochronology—the science of dating past events using tree rings. Douglass is shown coring a tree on the slopes of Mount Lemmon, above Tucson, Arizona. Schulman is pictured studying a pine cone in the same area. (Photographs by Charles Herbert, copyright University of Arizona Laboratory of Tree-Ring Research.
Photograph of logs amid the ruins of an ancient pueblo village.
In the 1950s one of Douglass’ former students and a respected tree researcher in his own right, Edmund Schulman, headed into the White Mountains to look at the trees rumored to be very old. He discovered Methuselah and the old bristlecone pines surrounding it. Around the trees, even older dead trees remained on the ground. Together, they gave a climate record of the Southwest United States that extends back 9,000 years, the longest record for a single tree species. In Europe scientists have combined the ring-records from various trees to piece together the past 11,000 years of Europe’s climate history.
The first long-term record from tree rings was assembled from logs used in ancient Native American pueblos in the American Southwest. (Photograph copyright Scott August)
Douglas’ rings tell about rainfall in the southwestern United States, but trees also respond to changes in sunlight, temperature, and wind, as well as non-climate factors like the amount of nutrients in the soil and disease. By observing how these factors combine to affect tree rings in a region today, scientists can guess how they worked in the past. For example, rainfall in the southwestern United States is the factor that affects tree growth most, but in places where water is plentiful, like the Pacific Northwest, the key factor affecting tree ring growth may be temperature. Once scientists know how these factors affect tree ring formation, scientists can drill a small core from several trees in an area (a process that does not harm the tree) and determine what the climate was in previous years. The trees may also record things like forest fires by bearing a scar in a ring.
Short- and long-term variability of rainfall along the eastern margin of the Sierra Nevada is recorded in bristlecone tree rings. Several long and intense droughts that appear in the tree-rings are also found in sediments in nearby Mo
Individual events such as forest fires are recorded in tree-rings. The dark arcs that interrupt the sequence of rings in this sample were caused by fires in the 19th century. (Photograph copyright Henri D. Grissino-Mayer)
no Lake. (Graph derived from Hughes 1996)
Paleoclimatology A Record from the Deep
by Holli Riebeek · design by Robert Simmon · September 27, 2005

Clad in a hard hat and steel-toe boots, paleoceanographer Jerry McManus strides onto the deck of the JOIDES Resolution, staring through the steel rigging that supports the ship’s drilling equipment at the brilliant star-studded sky. Here, in the middle of the ocean, city lights do not dim the night sky, and the clear view is spectacular. McManus, an associate scientist at the Woods Hole Oceanographic Institution, has just completed another 12-hour shift in one of the ship’s six science labs, where he has been analyzing samples of the sea floor to glean bits of evidence about past climates.
Even now, in the dead of the night, it is not quiet. The ship’s twelve powerful thrusters whine constantly as their 750-horsepower engines struggle against the ocean currents to keep the ship in one place while the drilling crew pulls long sections of mud from the sea floor. The science labs continue to bustle as another crew replaces those who are leaving for the night, and caterers and housekeepers move through the ship to support the science and drilling teams. McManus pauses to scan the surface of the ocean for signs of whales or other sea life. He saw a manta ray jumping once, but not tonight. He returns to his room in the forecastle deck. Two sets of bunk beds accommodate the four people who share the room, but he rarely sees his roommates. They are on other shifts in this all-too-brief voyage to coax climate secrets out of the ocean depths.
The JOIDES Resolution cruises the globe sampling sediments from the bottom of the world’s oceans. The ship is capable of drilling holes over 2,100 meters (6,890 feet) below the sea floor in water up to 8,000 meters (26,000 feet) deep. (Photograph courtesy JOI Alliance/IODP)
Photograph of scientists over a core table
Researchers study a freshly recovered sediment core inside one of the science labs on board the Resolution. (Photograph courtesy JOI Alliance/IODP)
Year after year, a steady rain of dust, plants, and animal skeletons settles on the ocean floor. As new materials pile on top of old materials, layers of sediment form a vertical timeline extending millions of years into the past. McManus and his colleagues on the Resolution are drilling long cores of the ocean floor to read the timeline. The 470-foot-long research vessel is specially equipped to pull cores of mud from the sea floor. Much of equipment, and the ship itself, is adapted from tools the oil industry uses to drill at sea, and, as a result, the Resolution resembles an oil rig with its steel drill tower and deck-top cranes
In the center of the ship, long sections of pipe snake down to the sea floor where a drill is fitted on the outside of the pipe. A solid piston inside the pipe moves up as the pipe plunges into the mud so that the pipe fills with mud as it sinks. The goal is to pull up a column of sediment without disturbing it. Stirring the sediment would destroy the timeline preserved in the layers. The pipe draws up 10-meter segments of earth at a time. A cone with a homing device rests over the drill hole so the pipe can be lowered into the same location to retrieve the next 10 meters until the drill hits the solid rock of the sea floor.
Drilling on board the Resolution continues day and night. From top to bottom: drilling derrick, drill bit, re-entry cone, and a retrieved core. (Photographs courtesy JOI Alliance/IODP)
The Resolution is perhaps the most advanced scientific ocean drilling ship, and an international consortium of ocean researchers called the International Ocean Drilling Program is responsible for it. Though the technology is vastly different, the idea of a science-dedicated ocean exploring vessel isn’t too far off from the first explorations in the 1870s. On December 21, 1872, a three-masted, square-rigged wooden ship set sail from Portsmouth, England, to start a three-and-a-half-year voyage that would take the HMS Challenger from the North Atlantic to Antarctica and around the world. The ship’s crew and teams of physicists, biologists, and chemists from around the world sounded out the depths of the ocean, collected samples of plants and animals and ocean water, and recorded sea temperature at various depths. They published their results in a 50-volume report, each volume containing 29,500 pages. The voyage of the Challenger became the basis of modern oceanography.
Scientists on the Challenger dredged the ocean floor with large bags to collect plant and animal samples. They found that the ocean was covered in fine sediment that contained the fossils of sea animals. What was more, the fossils were different in cold areas verses warm areas. The finding thrilled paleoclimatologists, who wanted to use the fossils to determine how cold the oceans had been in the past. Scientists almost immediately began to devise systems of hollow pipes that could be used to bring a column of the sea floor to the surface.

These records from the deep yielded many important insights to the Earth’s past climates. Each layer within the core holds fossils of the tiny plants and animals that dominate the ocean, as well as grains of dust and minerals that can tell about wind and current patterns. Like land fossils, marine fossils offer clues about conditions in the ocean when the plant or animal lived. The cores are
Ice sheets contain a record of hundreds of thousands of years of past climate, trapped in the ancient snow. Scientists recover this climate history by drilling cores in the ice, some of them over 3,500 meters (11,000 feet) deep. These photographs show experimental drilling on the Greenland Ice Cap in summer 2005. (Photographs copyright Reto Stöckli, NASA GSFC)
Photograph of glowing blue snow pit
The seasonal snow layers are easiest to see in snow pits, writes Alley, the Evan Pugh Professor in the Environment Institute and Department of Geosciences at Pennsylvania State University. To see the layers, scientists dig two pits separated by a thin wall of snow. One pit is covered, and the other is left open to sunlight. By standing in the covered pit, scientists can study the annual snow layers in the snow wall as the sunlight filters through the other side. “I have stood in snow pits with dozens of people—drillers, journalists, and others—and so far, every visitor has been impressed. The snow is blue, something like the blue seen by deep sea divers, an indescribable, almost achingly beautiful blue,” writes Alley. “The next thing most people notice is the layering.”

carefully labeled (“this way up” is a crucial designation for the vertical time lines) and divided into smaller sections for analysis.

Blue light filtered through the wall of an Antarctic snow pit illuminates "Tuck," the mascot for Tuckahoe Elementary School in Henrico County, Virginia. The furry white owl accompanied scientists to Antarctica as part of an educational program. In the wall of the pit, dark and light bands of slowly compacted snow distinguish snow deposited in the winter from snow deposited in the summer. (Photograph courtesy Christopher Shuman, NASA GSFC)
To pry climate clues out of the ice, scientists began to drill long cores out of the ice sheets in Greenland and Antarctica in the late 1960s. By the time Alley and the GISP2 project finished in the early 1990s, they had pulled a nearly 2-mile-long core (3,053.44 meters) from the Greenland ice sheet, providing a record of at least the past 110,000 years. Even older records going back about 750,000 years have come out of Antarctica. Scientists have also taken cores from thick mountain glaciers in places such as the Andes Mountains in Peru and Bolivia, Mount Kilimanjaro in Tanzania, and the Himalayas in Asia.
Researchers retrieve climate records from mountain glaciers in addition to the records from polar ice sheets. Drilling sites around the world help distinguish trends in local climate from trends in global climate. This drilling station is located at an elevation of 6,425 meters (21,080 feet) on the summit of Nevado Coropuna in the Peruvian Andes. (Photograph copyright Jason Box, Ohio State University/Byrd Polar Research Center)
Photograph of ice core drilling station on the summit of Nevado Coropuna, Peru
The ice cores can provide an annual record of temperature, precipitation, atmospheric composition, volcanic activity, and wind patterns. In a general sense, the thickness of each annual layer tells how much snow accumulated at that location during the year. Differences in cores taken from the same area can reveal local wind patterns by showing where the snow drifted. More importantly, the make-up of the snow itself can tell scientists about past temperatures. As with marine fossils, the ratio of oxygen isotopes in the snow reveals temperature, though in this case, the ratio tells how cold the air was at the time the snow fell. In snow, colder temperatures result in higher concentrations of light oxygen. (See The Oxygen Balance.)


Researchers retrieve climate records from mountain glaciers in addition to the records from polar ice sheets. Drilling sites around the world help distinguish trends in local climate from trends in global climate. This drilling station is located at an elevation of 6,425 meters (21,080 feet) on the summit of Nevado Coropuna in the Peruvian Andes. (Photograph copyright Jason Box, Ohio State University/Byrd Polar Research Center
Scientists can confirm these chemistry-based temperature measurements by observing the temperature of the ice sheet directly. The ice sheet’s thickness makes its temperature much more resistant to change than the six inches of snow that might fall on your driveway during a winter snowstorm. As Alley explained to the Earth Observatory, the ice sheet can be compared to a frozen roast that is put directly into the oven. The outside heats up quickly, but the center remains cold, close to the temperature of the freezer, for a long time. Similarly, the ice sheet has warmed somewhat since the Ice Age, but not completely. The top has warmed as global temperatures have warmed, while the bottom has been warmed by heat flow from deep inside the Earth. But in the middle of an ice sheet, the ice remains close to the Ice Age temperatures at which it formed. “Because we understand how heat moves in ice, [and] we know how cold the ice is today, we can calculate how cold the ice was during the Ice Age,” says Alley.
When scientists lower an ultra-precise thermometer into a hole in the ice, they can detect the temperature variations that have occurred since the Ice Age. The near-surface ice temperature, like the atmosphere today, is warm, and then the temperature drops in the layers formed roughly between AD 1450 and 1850, a period known as the Little Ice Age, one of several cold snaps that briefly interrupted the overall warming trend ongoing since the end of the Ice Age. As the thermometer goes deeper into the ice sheet, the temperature warms again, and then plummets to the temperatures indicative of the Ice Age. Finally, the bottom layers of the ice sheet are warmed by heat coming from the Earth. These directly measured temperatures represent a rough average—a record of trends, not variable, daily temperatures—but climatologists can compare the thermometer temperatures with the oxygen isotope record as a way to calibrate those results.
Scientists measure the temperature of an ice sheet directly by lowering a thermometer into the borehole that was drilled to retrieve the ice core. Like an insulated thermos, snow and ice preserve the temperature of each successive layer of snow, which reflects general atmospheric temperatures when the layer accumulated. Close to the surface of the bedrock, the lowest layers of the ice are warmed by the heat of the Earth. These physical temperature measurements help calibrate the temperature record scientists obtain from oxygen isotopes. (Graph based on data provided by Gary Clow, United States Geological Survey)
As valuable as the temperature record may be, the real treasure buried in the ice is a record of the atmosphere’s characteristics. When snow forms, it crystallizes around tiny particles in the atmosphere, which fall to the ground with the snow. The type and amount of trapped particles, such as dust, volcanic ash, smoke, or pollen, tell scientists about the climate and environmental conditions when the snow formed. As the snow settles on the ice, air fills the space between the ice crystals. When the snow gets packed down by subsequent layers, the space between the crystals is eventually sealed off, trapping a small sample of the atmosphere in newly formed ice. These bubbles tell scientists what gases were in the atmosphere, and based on the bubble’s location in the ice core, what the climate was at the time it was sealed. Records of methane levels, for example, indicate how much of the Earth wetlands covered because the abundance of life in wetlands gives rise to anaerobic bacteria that release methane as they decompose organic material. Scientists can also use the ice cores to correlate the concentration of carbon dioxide in the atmosphere with climate change—a measurement that has emphasized the role of carbon dioxide in global warming. (see “Explaining the Evidence.”)

Finally, anything that settles on the ice tends to remain fixed in the layer it landed on. Of particular interest are wind-blown dust and volcanic ash. As with dust found in sea sediments, dust in ice can be analyzed chemically to find out where it came from. The amount and location of dust tells scientists about wind patterns and strength at the time the particles were deposited. Volcanic ash can also indicate wind patterns. Additionally, volcanoes pump sulfates into the atmosphere, and these tiny particles also end up in the ice cores. This evidence is important because volcanic activity can contribute to climate change, and the ash layers can often be dated to help calibrate the timeline in the layers of ice.

Though ice cores have proven to be one of the most valuable climate records to date, they only provide direct evidence about temperature and rainfall where ice still exists, though they hint at global conditions. Marine sediment cores cover a broader area—nearly 70 percent of the Earth is covered in oceans—but they only give tiny hints about the climate over the land. Soil and rocks on the Earth’s surface reveal the advance and retreat of glaciers over the land surface, and fossilized pollen traces out rough boundaries of where the climate conditions were right for different species of plants and trees to live. Unique water and rock formations in caves harbor a climate record of their own. To understand the Earth’s climate history, scientists must bring together all of these scattered threads into a single, seamless story.


Air bubbles trapped in the ice cores provide a record of past atmospheric composition. Ice core records prove that current levels of carbon dioxide and methane, both important greenhouse gases, are higher than any previous level in the past 400,000 years. (Photograph courtesy U.S. National Ice Core Laboratory)
Finally, anything that settles on the ice tends to remain fixed in the layer it landed on. Of particular interest are wind-blown dust and volcanic ash. As with dust found in sea sediments, dust in ice can be analyzed chemically to find out where it came from. The amount and location of dust tells scientists about wind patterns and strength at the time the particles were deposited. Volcanic ash can also indicate wind patterns. Additionally, volcanoes pump sulfates into the atmosphere, and these tiny particles also end up in the ice cores. This evidence is important because volcanic activity can contribute to climate change, and the ash layers can often be dated to help calibrate the timeline in the layers of ice.


Some features of this site are not compatible with your browser. Install Opera Mini to better experience this site.

Published Jan 18, 2000
Svante Arrhenius
by Steve Graham • January 18, 2000
Svante ArrheniusA hundred years ago, Swedish scientist Svante Arrhenius asked the important question “Is the mean temperature of the ground in any way influenced by the presence of the heat-absorbing gases in the atmosphere?” He went on to become the first person to investigate the effect that doubling atmospheric carbon dioxide would have on global climate. The question was debated throughout the early part of the 20th century and is still a main concern of Earth scientists today.
Ironically, Arrhenius’ education and training were not in climate research, but rather electrochemistry. His doctoral thesis on the chemical theory of electrolytes in 1884 was initially regarded as mediocre by his examination committee, but later was heralded as an important work regarding the theory of affinity. In 1891, Arrhenius was a founder and the first secretary of the Stockholm Physical Society, a group of scientists whose interests included geology, meteorology, and astronomy. His association with this society would later help stimulate his interests in cosmic physics—the physics of the Earth, sea, and atmosphere. In 1903, Arrhenius was awarded the Nobel Prize for Chemistry for his work on the electrolytic theory of dissociation. In the years following his international recognition, Arrhenius lectured throughout Europe and was elected to numerous scientific societies.
next: Arrhenius' Carbon Dioxide Research
pullquoteOn the Shoulders of Giants
Svante Arrhenius
Arrhenius' Carbon Dioxide Research
Hot House Theory
Links and References


Images
Top: A portrait of Svante Arrhenius. (By Hailey M. King)


No comments:

Post a Comment